User productivity
Location: Home page, Biller
User Productivity provides a snapshot of activity while working displayed claims. You can view this graph on your Home page, if your user account is assigned the biller role and your group has the View My Productivity and View Dashboard rights. By default, the graph shows activity for Today. Use the drop-down field to select a different relative time frame: Last 30 Days, Month to Date, Week to Date, or Yesterday. Use the Custom Date Range option to choose any date span within the last 30 days.
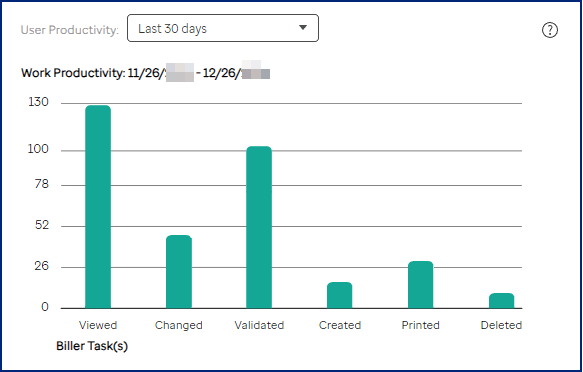
All activity categories except Created track work through the claim toolbar. Batch jobs through menu options are excluded from the metrics.
- If you select any relative time frame, the system remembers your selection, even if you navigate to another feature and return Home or if you log out and then back in. The system does not remember custom date ranges. If your last selection was a custom range, then the system displays the graph for the default date value of Today.
- Click the chart to drill down through the results, all the way to the claim list, if needed.
- As you drill down through changed claims, you can click the View Changes link next to each claim record to see a list of your changes.